Quarterly update · Q3 2026 · marketing communication
This quarterly update is also available as a PDF, to keep or to forward. Download the quarterly update (PDF, 13 pages).
After two moves by the ECB, the Federal Reserve raised rates too, for the first time since 2023, and oil cost well over 100 dollars again. This update shows what that meant for the three funds, each of which spreads across different strategies in its own way.
In this issue
- Rates, oil and a concentrated market
- What stocks did after earlier rate hikes
- The effect of the US midterm elections
- Crypto and the new box 3 plans
- Return by fund and by asset class
- BOTS Capital this autumn
Dear investor,
This is the second quarterly update since Protector I, Builder II and Visionary III launched on 1 April. The funds are managed by Elite Fund Management B.V. (Elite), a licensed manager, and only Elite selects the investments. At BOTS we provide Elite with general investment research and handle the marketing of the funds, such as this update. We do not advise on specific investments. Below is a general overview of what happened in markets and what it meant for the funds.
The quarter in short
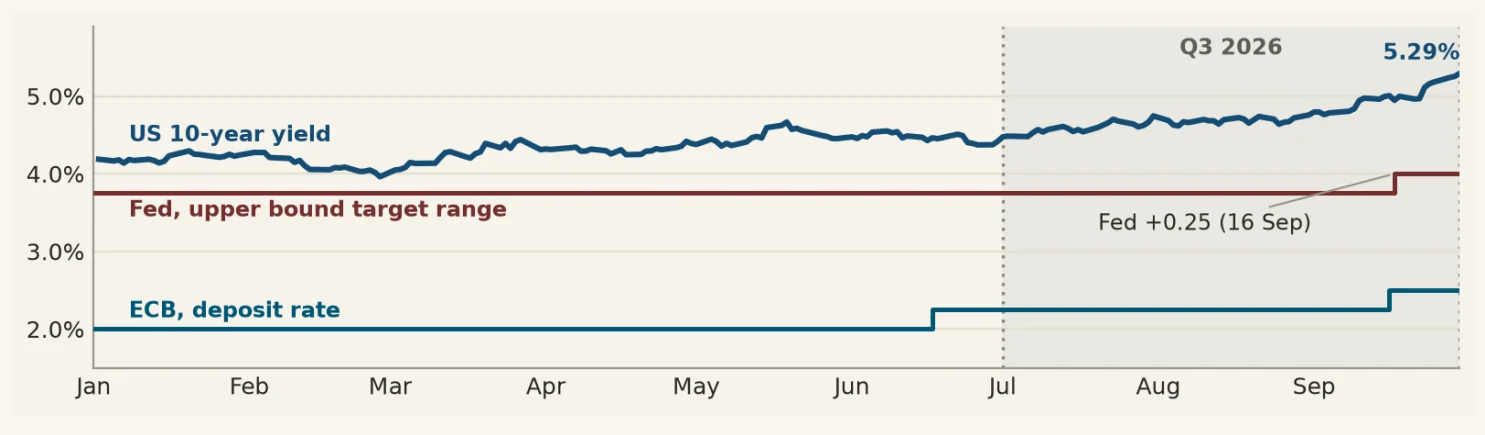
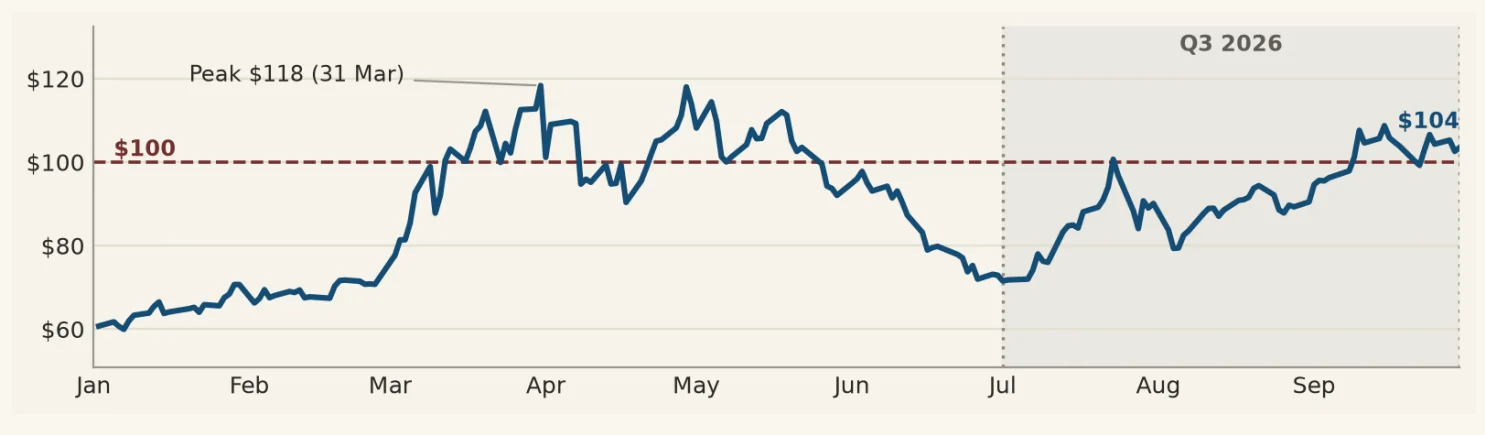
The third quarter was about interest rates. The ECB raised rates on 10 September for the second time this year, and six days later the Federal Reserve followed with its first hike since 2023. Both central banks consider inflation too high, partly because of more expensive energy. The conflict around Iran pushed oil up again, from 73 dollars a barrel at the end of June to 104 dollars now. The US 10-year yield climbed from 4.4% to 5.3%, the highest level since 2007.
Equity markets hardly noticed. The S&P 500 gained 2.0% in the quarter, despite a sharp correction in technology shares in July. Bitcoin recovered strongly and gold had one of its best months in a quarter of a century in August. US bonds lost 3.5%.
Market data: S&P 500, Nasdaq 100, ICE Brent, U.S. Treasury, Bloomberg US Aggregate (via ETF) and bitcoin via Yahoo Finance; rate decisions: Federal Reserve and ECB; gold: World Gold Council. Data through 30 September 2026.
Three themes that shaped the quarter
Rates are back
Since 2024 interest rates had mostly gone down. This year that has reversed. The ECB took its deposit rate to 2.25% on 11 June and to 2.50% on 10 September. It points to the conflict in the Middle East, which keeps pushing up inflation. Its own economists expect 3.0% inflation in the euro area this year and 0.9% growth.
US 10-year yield, Fed rate and ECB rate in 2026 (%)
Source: U.S. Department of the Treasury (10-year yield, via Yahoo Finance); Federal Reserve (upper bound of the target range) and ECB (deposit rate), press releases. Data through 30 September 2026.
The Federal Reserve raised rates unanimously on 16 September by a quarter point, to 3.75% to 4.00%. According to Chair Kevin Warsh, inflation is too high and has been for too long. Sixteen of the eighteen policymakers expect rates to be higher still at the end of this year.
The bond market was ahead of the central banks. In mid-September the US 10-year yield broke through 5%, for the first time since 2007. In Japan the 10-year yield rose above 3%, the highest since 1996. Goldman Sachs Asset Management points to larger government deficits, heavy long-dated borrowing by technology companies for their data centres, and more expensive energy.
Oil and commodities climb again
In the second quarter Brent crude still fell below 100 dollars. Now the price is 104 dollars a barrel, 42% above the end of June. According to traders, about 1 million barrels a day of oil products pass through the Strait of Hormuz, against about 4 million before the war (Bloomberg, 10 September). In late September Iran put forward a proposal at the United Nations in New York to reopen the Strait. President Trump rejected it on 26 September, but Qatar is continuing to mediate between the two countries. When this update was written there was no agreement yet. A breakthrough could bring the oil price down quickly. If the conflict escalates further, it could rise further.
Copper rose 5.9% and was at its highest level of the year in September. Gold rose 13% in August, one of its strongest months in 25 years according to the World Gold Council, and gave back part of that in September. Goldman Sachs Asset Management speaks of a ‘supercycle’ in resource security, because countries want to depend less on others for energy and critical metals. That is their view, not our expectation for the funds.
Brent crude oil price in 2026 (USD/barrel)
Source: ICE Brent, front-month futures contract, via Yahoo Finance. Data through 30 September 2026.
A market leaning on a few companies
Up almost 15%, the S&P 500 had its best quarter since 2020 in the second quarter. It rose again this quarter despite higher rates, and since January it is up 11.8%. In July the most popular technology shares were sold off hard. The Nasdaq 100 fell 6.6% and was back around its end-June level by late September.
Whether the market is expensive depends on the measure. On expected earnings for the coming year the S&P 500 trades at about 19 times earnings, around its five-year average. Analysts expect almost 29% earnings growth for the third quarter, mostly at energy and technology companies (FactSet). Take average earnings over ten years, the Shiller CAPE, and the index comes out at about 41. It was more expensive only around 2000.
European tech sector: market cap in EUR bn
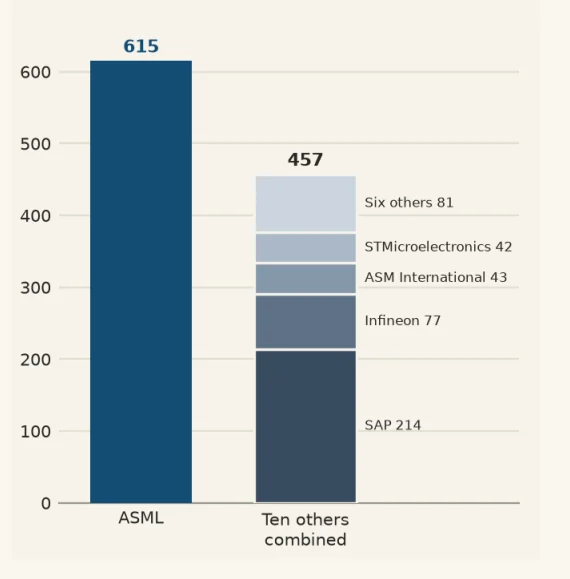
Source: Yahoo Finance; market cap = closing price × shares outstanding, 29 September 2026. EEA-domiciled technology companies without a primary US listing. BOTS calculations.
A large part of that value sits in a small number of technology companies. In Europe it is even more pronounced. ASML alone is worth more than ten other large European technology companies combined, SAP included. These are profitable companies. Anyone who buys the index, though, is increasingly dependent on a handful of names.
What stocks did after earlier rate hikes
We looked at what the US stock market did after the first rate hike in the five rate-hiking cycles since 1994. The table shows the S&P 500 price change three, six and twelve months after the first hike, and the valuation (Shiller CAPE) at that moment.
S&P 500 after the first rate hike
| First hike | After 3m | After 6m | After 12m | CAPE at start |
|---|---|---|---|---|
| Feb 1994 | −5.9% | −2.5% | +2.4% | 21.3 |
| Jun 1999 | −7.6% | +6.6% | +6.0% | 42.2 |
| Jun 2004 | −2.3% | +6.4% | +5.2% | 26.4 |
| Dec 2015 | −1.1% | −0.1% | +9.1% | 26.0 |
| Mar 2022 | −13.0% | −10.5% | −10.1% | 34.3 |
| Sep 2026 (now) | to follow | to follow | to follow | 41.3 |
S&P 500 price return (excluding dividends) from the close on the day of the decision; 3, 6 and 12 months = 63, 126 and 252 trading days. n = 5 completed cycles. Descriptive, not a forecast. Source: Federal Reserve (decision dates); Yahoo Finance (S&P 500); Robert Shiller and multpl.com (CAPE). BOTS calculations.
Three months after the first hike the index was lower all five times. A year later it was higher four times and lower once, in 2022. That year the Fed took rates from close to zero to 4.50-4.75% within a year, the largest rise of the five. With five cycles that is not a relationship to rely on. Starting valuations varied widely, and only in June 1999 was the CAPE as high as today. This table describes the past and predicts nothing. The team is keeping an eye on the current cycle, and in the coming quarterly updates we will fill in the September 2026 row once three, six and twelve months have passed.
The effect of the US midterm elections
On 3 November Americans elect a new House of Representatives and 35 of the 100 senators. It is often said that equities do well after these ‘midterms’. Our research team checked that with what is known as an event study. You line up all 24 midterms since 1930 on one timeline, with the result as day zero, and compare the price path with the same weeks in years without an election.
Little out of the ordinary happens in the days around the vote itself. Early November is strong on average, around the turn of the month, election or not. The difference comes afterwards. In the six months after a midterm the S&P 500 rose 10.0% on average, against 1.9% in the same weeks of other years. By pure chance you would see a difference that large in fewer than 1 in 200 cases. The strongest window ran from about three weeks before to eight months after the election and returned 13.6% above short-term US Treasury bills, against −0.4% in other years.
This may be because uncertainty falls away. After the result it is clearer how much policy the president can still push through. Which party wins makes no difference to the broad market or the Nasdaq. Strongly policy-sensitive sectors sometimes responded differently, but a separate test did not confirm that.
This year is different. An average midterm year is flat into the autumn, while the S&P 500 is now about 13% above its level of November 2025. After strong years the rise in the window was smaller, about 11% instead of 16%, although that difference is not significant. In the market data from 1871 to 1927 the effect is absent. Anyone sceptical of calendar patterns will not be convinced by these figures. And this election coincides with the Fed’s first rate hike since 2023, in a House of Representatives more polarised than at any time in the study period (Voteview).
S&P 500 around the midterms, 2026 alongside the average since 1930
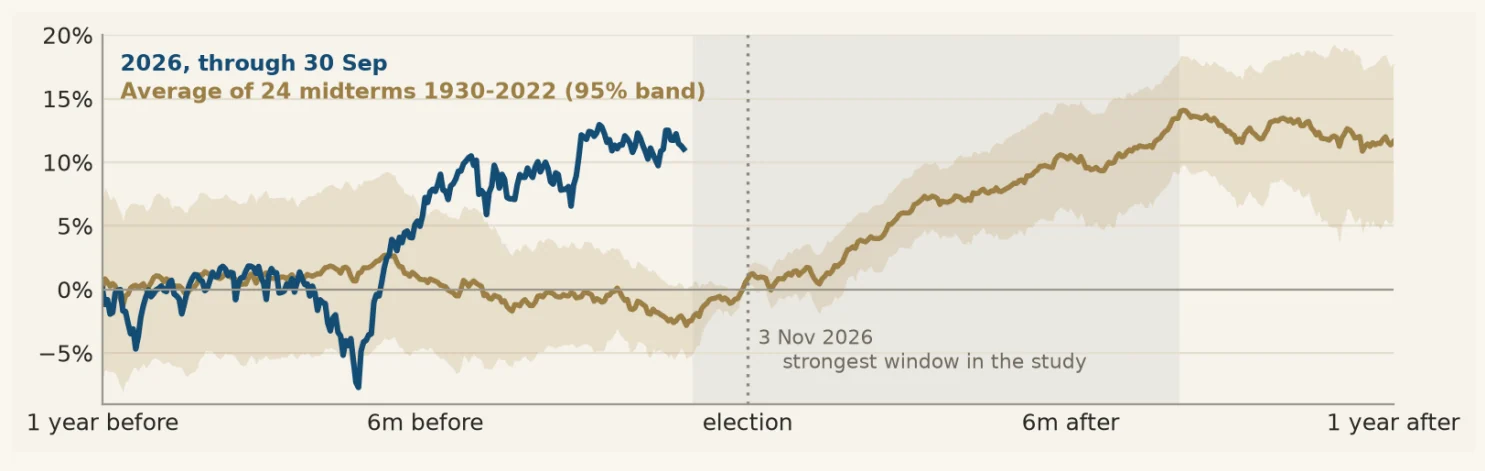
Source: BOTS Capital working paper, September 2026; S&P 500 data via Yahoo Finance, CRSP/Kenneth French. Average of 24 midterms 1930-2022 with 95% band; 2026 through 30 September 2026. The average is not a forecast for 2026.
This is research, not a forecast and not a recommendation. Past patterns need not repeat. The full paper will soon be published on our website, under Analyses & market view.
Crypto left out of the new box 3 plans
On 29 September the Dutch cabinet sent parliament a new proposal for box 3, the tax on savings and investments. It wants to move as quickly as possible to a tax on the gains you actually make, a capital gains tax. From 2028 that tax would apply to all financial instruments, such as shares, bonds and options. According to the cabinet, this covers about 90% of the box 3 assets whose value changes. All other assets would follow in 2030.
The difference lies in when you pay. Under an accrual tax, the original plan, you pay every year on the increase in value, even if you sell nothing. Under a capital gains tax you only pay when you actually take the gain.
The same letter contains measures that start earlier. In 2027 the tax-free allowance returns to its 2020 level of € 30,846, and the deemed return on other assets rises by 1.5 percentage points. From 2028 the first € 1,000 of income is exempt. By the cabinet’s own example, a saver earning 2% interest would then pay no tax on the first € 50,000.
Crypto is not mentioned in the letter. A coin you hold yourself is not a financial instrument in the legal sense, so someone who owns bitcoin directly would not move to the capital gains tax until 2030. An exchange-traded product on bitcoin, such as an ETF, does count as a financial instrument. The Dutch association of crypto service providers (NVC) is seriously concerned. “Exactly the same bitcoin, but wrapped in a derivative instrument, an ETF, is taxed differently,” chairman Mauro Halve told BNR. He calls it a waterbed effect. Investors would lean towards the listed product rather than the coin itself.
According to the NVC, Dutch crypto firms would bear the brunt. They have a relatively large share of Dutch clients, who pay box 3 tax, while international platforms feel much less of it, and the association fears clients will move abroad. Halve finds that especially hard to accept. Many Dutch providers have obtained a licence under the European crypto rules (MiCA) in recent years and are treated as financial service providers in Europe. The NVC wants crypto held directly to fall under the capital gains tax from 2028 as well, and is lobbying parliament to change the proposal.
Whether the proposal passes in this form is still open. The cabinet is tabling it as an amendment to the box 3 actual-return bill, which the Senate must pass before 31 December. The minority cabinet needs support from both sides of parliament. Funding is disputed. During the annual budget debate, which began on 30 September, an opposition party said ministry figures show a gap of several billion euros. In its letter the cabinet finds the funding within box 2 and box 3.
What does this mean for you as an investor in the funds? All three funds can invest partly in market-neutral digital-asset strategies, and Visionary III also has a small position that moves with bitcoin. You hold units in the fund, not the crypto itself. How the new rules apply to those units depends on how the amendment is drafted and on its passage through both houses, and that is not settled. Future performance is subject to taxation, which depends on your personal situation and may change in the future. This is therefore not tax advice. For your situation, please consult a tax adviser. We are following the process and will come back to it once the rules are final.
Source: cabinet letter to the Dutch House of Representatives, ‘Voorstellen op box 3, koopkracht werkenden en sociale zekerheid’, 29 September 2026; BNR Nieuwsradio, 30 September and 1 October 2026.
What this meant for the three funds
The funds spread across strategies that tend to behave differently. The July and August figures come from the NAV administration of IQ-EQ, the administrator appointed by Elite. September is an estimate based on information from the managers of the underlying funds. Before a NAV is struck, each underlying fund’s valuation is checked against the underlying manager’s own statement.
Past performance (July and August) is no guarantee of future results. The scenarios shown (September) are an estimate of future performance based on evidence from the past, and are not an exact indicator. What you get will vary depending on how the market performs and how long you keep the investment. Part of the investments is illiquid in nature.
- The relative-value bond strategy does not need rates to rise or fall. It is set up to earn from movement and from the relationships between bonds. In July it was the largest contributor to Protector I and Builder II, and it contributed positively again in August.
- The market-neutral crypto strategies are designed to earn from price differences between trading platforms, not from the direction of crypto. July and August both brought a small gain. August came out lower because part of the gain was already in the July figures. Visionary III also holds a small position that does move with bitcoin, and bitcoin rose 24% in euro in August. That position contributed just over 0.4 percentage points to Visionary III’s return in August.
- The thematic equity strategy and the commodity and energy strategy are the most volatile part. In July the thematic equity strategy fell with the correction in popular growth stocks, while the commodity and energy strategy gained in dollars. In August they carried the result of Builder II and Visionary III. In September the thematic equity strategy in particular fell sharply, so Builder II and Visionary III are estimated to have come out lower.
- The dollar lost 1.5% against the euro over July and August combined. That cost the unhedged dollar positions in Builder II and Visionary III some return. In September that reversed. The dollar strengthened again, which is estimated to have made up much of the September decline.
Protector I rose 0.85% in July and 0.26% in August, after costs. In both months the gain came mainly from the relative-value bond strategy.
A positive return from the funds is not guaranteed. You may lose some or all of your investment.
Why the three funds move differently from the market
The big equity indices are carried mainly by a handful of technology and AI companies. The underlying strategies of the three funds do not currently invest in them. They look for returns in price differences between trading platforms, in the relationships between bonds and in energy and commodities. So a tech-driven market does not automatically pull them up. That does not mean the funds move more calmly than the market. Protector I has risk indicator 3 out of 7. Builder II and Visionary III have risk indicator 6 and 7 out of 7 and can swing sharply.
On the underlying managers’ own track records, over 66 months, the average pairwise correlation of the strategies in Builder II was low, 0.02 in calm and 0.04 in stressed months. In Protector I it was slightly negative. That is a look-through calculation on the managers’ history, not on the funds themselves, and says nothing about future correlation. Goldman Sachs Asset Management noted in July that the classic mix of 60% equities and 40% bonds offers less diversification now that equities and bonds often move together.
The scenarios shown for the funds are an estimate of future performance based on evidence from the past, and are not an exact indicator. What you get will vary depending on how the market performs and how long you keep the investment.
Return by asset class and by fund · Q3 2026
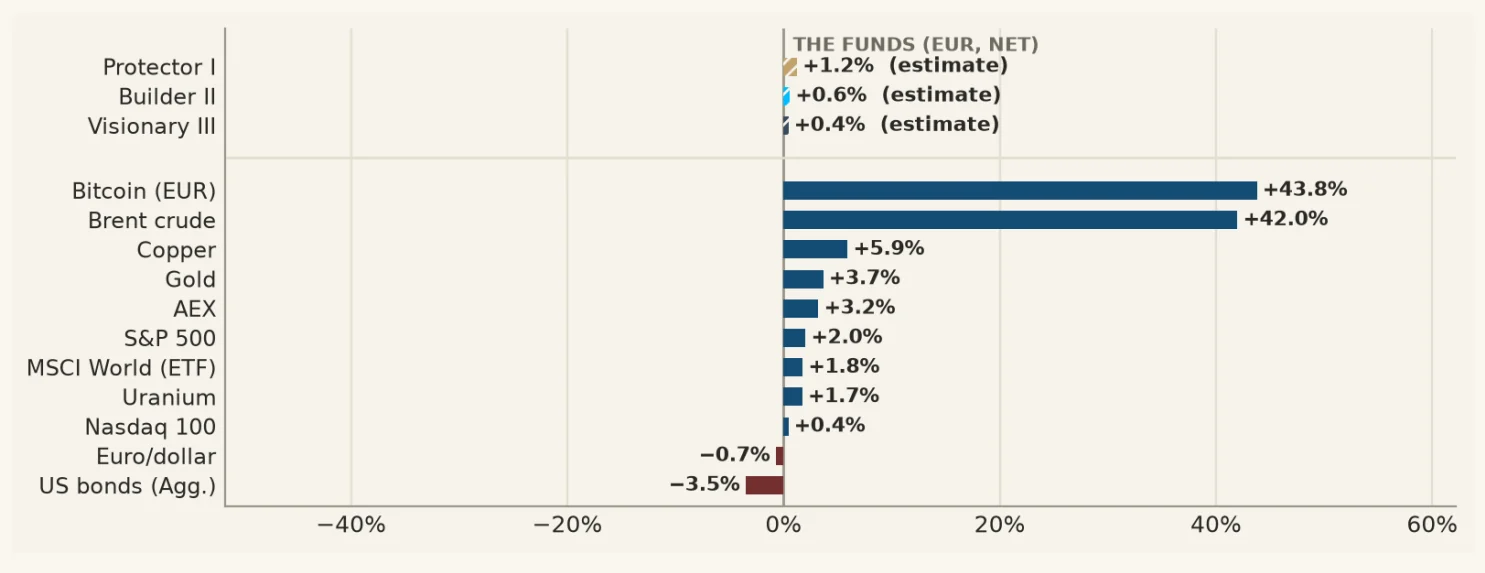
Source: Yahoo Finance, BOTS calculations. Nasdaq 100, S&P 500 and AEX: indices; MSCI World and Bloomberg US Aggregate: iShares ETFs (URTH, AGG); Brent: ICE; copper and gold: COMEX; uranium: Sprott Physical Uranium Trust; bitcoin in euro. Markets in local currency. Funds: net, NAV-based, in euro; July and August final (IQ-EQ), September preliminary estimate. Data through 30 September 2026.
The three multi-asset funds
Each fund mixes the strategies differently, and returns diverged in line with their risk level. The risk indicator below (3/7, 6/7, 7/7) matches the summary risk indicator (SRI) in each fund’s Essential Information Document (EID).



Past performance (July and August) is no guarantee of future results. The scenarios shown (September) are an estimate of future performance based on evidence from the past, and are not an exact indicator. What you get will vary depending on how the market performs and how long you keep the investment.
Return by fund · net, NAV-based
| Fund | July | August | September* | Q3* | Since launch (1 Apr)* |
|---|---|---|---|---|---|
| Protector I (defensive, 3/7) | +0.85% | +0.26% | +0.1% | +1.2% | +2.5% |
| Builder II (medium offensive, 6/7) | −0.01% | +0.74% | −0.1% | +0.6% | −0.1% |
| Visionary III (offensive, 7/7) | −0.28% | +1.20% | −0.5% | +0.4% | −1.3% |
* September is a preliminary estimate based on information from the managers of the underlying funds and exchange rates at 30 September. The Q3 and Since launch columns include that estimate. July and August are final. Returns are net, based on the fund NAV, in euro. Estimates rounded to 0.1%. Source: IQ-EQ NAV administration (April to August); September: preliminary estimate.
In the Q2 update we published a June estimate of +0.28% / +0.17% / −0.12% (Protector I, Builder II, Visionary III). IQ-EQ’s final figures came in at +0.26% / +0.16% / −0.20%.
Protector I (defensive, risk 3/7) has moved within a narrow range since launch, between +0.1% and +0.9% a month (September: estimate), and is up 2.5% (estimate). It holds no commodities. Builder II (medium offensive, risk 6/7) moved less than Visionary III, because the steadier strategies largely absorbed the swings of the commodity strategies. Visionary III (offensive, risk 7/7) leans most on energy and commodities and moved the most, with the largest loss in July, the largest gain in August and, by estimate, again the largest loss in September. That fits the most offensive profile, with bigger swings in the short term in exchange for more return potential over the long term. A higher return from the offensive funds is not guaranteed.
After two quarters there is little to conclude yet. The more offensive profiles are best judged over years.
Outlook
Four things stand out for the final quarter. Most Fed policymakers expect one more hike this year, the ECB decides meeting by meeting, and US long-term yields are at their highest in almost twenty years. A deal on the Strait of Hormuz could bring oil down quickly, and renewed escalation could push it higher. The equity market is highly concentrated and, on the Shiller CAPE, highly valued, although earnings are growing strongly (FactSet). And on 3 November come the midterms. Goldman Sachs Asset Management wrote in mid-September that central banks are now mainly managing risks, and that economic fundamentals have become the anchor for markets.
The most volatile part of the funds remains the thematic equity strategy and the commodity and energy strategy, which are the most sensitive to oil, metals and the dollar. The portfolios are rebalanced every month within fixed risk limits. Even with that monthly rebalancing, investing involves risk. You may lose some or all of your investment.
Within their mandate the funds can also take directional positions, which do move with a market. Visionary III already holds one. The small part that moves with bitcoin stays in the fund. On top of that, the manager is looking closely this autumn at a directional position in equities for Visionary III, the most offensive profile. The findings of the midterm research are a serious consideration, alongside interest rates and market valuations. For Builder II it would, if it comes to that, be a smaller step. Such positions are only taken when the manager judges the opportunities attractive enough, and always within each fund’s fixed risk limits. That can make both funds more volatile in the short term.
Protector I remains focused on stability. For that fund, a new strategy is in the final stage of review. The decision on including it lies with the manager, which runs the portfolio management of the funds. Meanwhile the BOTS team is also doing general research on strategies within the equity market. Despite these developments, stability is not guaranteed. You may lose some or all of your investment.
Returns are never fixed. The funds keep spreading across strategies that do not all move the same way at once, so that a single shock weighs less on the whole.
Expectations and outlook are our own assessment based on market developments (sources: see below) and are not a forecast or a guarantee.
Thank you for your trust. If you have any questions, call us on +31 (0)6 24 59 37 34 or visit us at Weesperstraat 107, 1018 VN Amsterdam.
Kind regards,
The BOTS Capital team
View the funds in the BOTS app or the web app. Track your investment and the underlying strategies. You log in to the web app with your mobile number and a text-message code, at botscapital.revenyou.io/login.
BOTS Capital this autumn
The Slim Beleggen podcast
Every month the team sits down for the Slim Beleggen podcast (in Dutch). We discuss the analysis of the BOTS Selection Framework and the news of that month, without price predictions, and if we got something wrong we say so next time. Episode #075 is the first devoted entirely to the BOTS Selection Framework, on how the model works, what the month brought and which strategies the model identified. Watch on YouTube or follow the podcast on Spotify. Recaps of earlier investor days are at youtube.com/@BOTSCapital.
De Analyse
Free, in your inbox. You receive a selection of teams, strategies and market opportunities found by the BOTS Selection Framework, with the reasoning behind why they passed the model and our view on the risks in the market at that moment. You can cancel at any time. Sign up at nl.bots.io/selectie.
Prinsjesdag 2026
In ‘De beleggingslogica achter Prinsjesdag 2026’ we go through what the Dutch 2027 budget means for investors. The deficit rises next year to 2.9% of GDP, just under the European limit of 3%. The CPB puts inflation at 3.3% this year. The piece was written before the box 3 letter of 29 September, covered earlier in this update. Read the piece (in Dutch).
Further reading
Two earlier pieces fit this quarter’s themes. ‘Wat er niet meer door de Straat van Hormuz gaat’ (9 August) explains why inventories, insurance premiums and alternative routes determine how long the world can absorb the disruption. ‘Wanneer wordt een dure markt té duur?’ (18 August) explains why two valuation measures for the S&P 500 contradict each other. Both are in the Knowledge centre (in Dutch), and we will keep publishing pieces there on what is happening in markets.
Events
- Investor evening Amsterdam, Tuesday 20 October 2026, 19:00-21:00, Weesperstraat 107. An evening for entrepreneurs and high-net-worth individuals on what higher rates and inflation mean for saving, investing and diversification.
- Investor evening Schagen, Tuesday 3 November 2026, 19:00-21:00, Westerpark 166, 1742 BX Schagen. At 19:15 ‘Rendement in een onrustige wereld’ (return in a restless world), followed by questions and drinks.
- BeleggersFair, Friday 13 November 2026, Beurs van Berlage, Amsterdam. BOTS Capital has a stand and gives the masterclass ‘Van chaos naar controle: live portefeuilleconstructie met de kracht van AI en risicobeheersing’. More at beleggersfair.nl/max-joosten.
Registration is required, at nl.bots.io/evenementen or on +31 6 24 59 37 34.
A personal conversation
Questions about the funds or this update? Call us on +31 (0)6 24 59 37 34, weekdays from 9:30 to 17:00. We will gladly arrange a conversation, online or at our office at Weesperstraat 107 in Amsterdam. A conversation is not personal investment advice.
Sources
- Fund returns: IQ-EQ NAV administration (April to August 2026, final); September: preliminary estimate based on information from the managers of the underlying funds.
- Prices and yields: Yahoo Finance, BOTS calculations. MSCI World and Bloomberg US Aggregate via the iShares ETFs URTH and AGG; uranium via the Sprott Physical Uranium Trust (as a proxy for the spot price); oil: ICE Brent; copper and gold: COMEX.
- Rate decisions: Federal Reserve (16 September 2026, with projections and press conference) and ECB (11 June and 10 September 2026, with the September 2026 projections). Dates of earlier rate hikes: Federal Reserve.
- Yields at records: Bloomberg, 15 September 2026 (US 10-year); CNBC, 24 September 2026 (Japan 10-year).
- Strait of Hormuz: Bloomberg, 10 September 2026. US-Iran talks: Al Jazeera, 23, 25 and 29 September 2026; Bloomberg, 24 September 2026; CBS News, 26 September 2026.
- Gold: World Gold Council, Gold Market Commentary August 2026.
- S&P 500 earnings growth and price-earnings ratio: FactSet Earnings Insight, 18 September 2026. Shiller CAPE: Robert Shiller (Yale University) and multpl.com.
- European tech sector: market cap (price × shares outstanding) via Yahoo Finance, BOTS calculations.
- Midterm research: ‘Midterm Elections and the S&P 500’, BOTS Capital working paper, September 2026. Price data: Yahoo Finance, CRSP via Kenneth French, Robert Shiller. Polarisation: Voteview (DW-NOMINATE).
- Correlation between the strategies: own BOTS calculation on the return series of the underlying managers over 66 months.
- Goldman Sachs Asset Management: Fixed Income Outlook 4Q 2026; Investing in the Resource Security Supercycle (22 September 2026); Hedge Funds’ Role in Today’s Market Environment (2 July 2026); Market Brief (18 September 2026).
- Box 3: cabinet letter to the Dutch House of Representatives, ‘Voorstellen op box 3, koopkracht werkenden en sociale zekerheid’, 29 September 2026 (parliamentary paper 2026Z20444); BNR Nieuwsradio, ‘Box 3-plan slaat ongedekt miljardengat in begroting’ (30 September 2026) and ‘Cryptosector vreest gevolgen box 3-regels, waterbedeffect’ (1 October 2026).
- Prinsjesdag: Dutch 2027 budget (Miljoenennota, Rijksoverheid) and Macro Economic Outlook 2027 (CPB).
This is marketing communication. It is for information only and is not investment advice or a recommendation. Investing involves risk. You may lose some or all of your investment. Returns are not guaranteed and past performance is no guarantee of future results. The September figures shown are a preliminary estimate and may still change. Read the prospectus and the Essential Information Document (EID) before making an investment decision. The three funds are managed by Elite Fund Management B.V. The manager holds an AIFMD licence and is entered in the register of the Dutch Authority for the Financial Markets (AFM). BOTS Capital is the trade name of CMS Holding B.V., Chamber of Commerce no. 71013253. BOTS Capital is a technology and analysis platform and is not itself a licensed asset manager or investment adviser.
BOTS Capital · Weesperstraat 107 · 1018 VN Amsterdam, the Netherlands · +31 (0)6 24 59 37 34 · support@bots.io · nl.bots.io